Is Climate Becoming More Extreme?
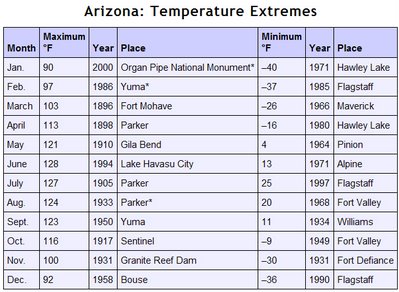
Bruce Hall at Hall of Record has performed a really interesting analysis. He created a data base for each state which shows in what year that state's monthly temperature records were set. So for each state, he has the years when the twelve monthly high temperature records were set (e.g. year of highest Arizona Jan temp, year of highest Arizona Feb temp, etc.) and the years when the twelve monthly low temperature records were set. Here, for example, is his data for Arizona:
So, for example, the record for the highest July temperature was set in 1905 at Parker, Arizona with a scorching 127 degrees. The entry in his database would then be Arizona-July: 1905. He notes that there is a bias in the data toward more recent years, since if the record was set in 1905 and tied in 1983, only the newer 1983 date will show in the data. I would also observe that this data is uncorrected for urban heat island effects (as cities urbanize they get hotter, and effect that is different than CO2-cause global warming and is usually corrected for in global warming studies). There is also a bias towards the present in having more measurement points today than 100 years ago: More measurement points means that, over a state, one is more likely to pick up the true high (or low).
Though I have other problems with the anthropomorphic global warming hypothesis, I have never really doubted that the world has warmed up over the last century. So even I, a skeptic, would expect a disproportionate number of the all-time high temperatures to be in the last decade, particularly without UHI correction and with the bias discussed above. The global warming folks would argue that the effect should be doubly pronounced, since they claim that we are seeing not just a general heating, but an increase in volatility (ie more extreme variation around the mean).
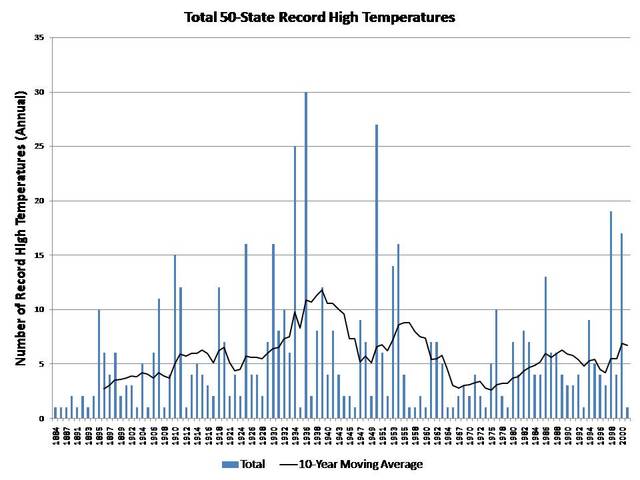
But Hall doesn't find this when he graphs the data. Take the 600 state monthly high temperature records that exist on the books today (50 states times 12 months) and graph the distribution of years in which these records were set:
Assuming about 120 years of data, you should expect to see a high temperature record on average in a database of 600 records at 5 per year, which is precisely where we have been of late and well below the record years in the thirties (remember the dust bowl?) and the fifties. It seems to actually show a reduction in temperatures or volatility or both. Hmm.
Of course, the US is not the whole world -- in fact, all developed land masses are only 25% of the world, so there is a lot not covered by such records. Also, statisticians are welcome to comment on whether looking only at extremes in a data set is even meaningful. But this sure isn't what you might expect from, say, watching the Oscar telecast or the nightly news.
Hall also has the low temperature records in his very comprehensive post, which, surprisingly, do show more activity in the last several decades. He has a follow-up here. Finally, Hall has summarized his data a different way in this post -- you have to click on the chart to really see it in all its beauty. Just take a quick look. I won't steal his thunder by reproducing it here, but suffice it to say it reminded me of some of the best examples in the book Visual Display of Quantitative Information.

