More Thoughts On Recent Employment Losses
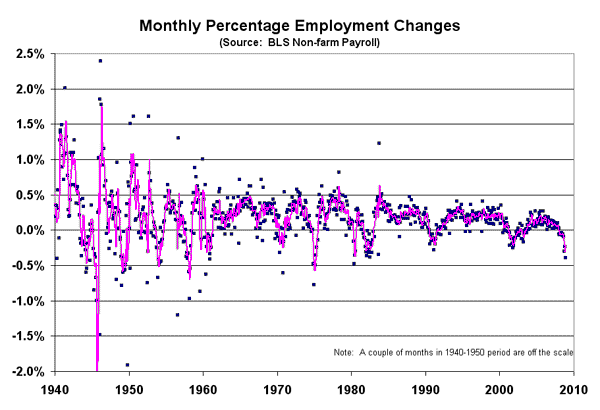
I posted some data this morning showing the current jobs report ranked not on absolute job losses but as a percentage of the total work force. I have now pulled the whole data set from the BLS, which goes back to about 1939, and this is what the entire monthly series looks like of employment changes as a percentage of total employment (the purple line is a 3-month moving average).
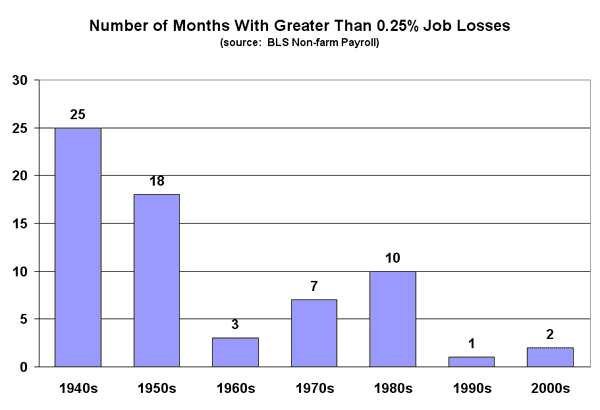
Folks familiar with this data base may know of reasons the data has become less volatile (perhaps improved seasonal adjustments?) but never-the-less, I have a hard time reconciling this with the popular leftish notion that the decline of traditional American manufacturers (e.g. autos) and unions have led to increasing risk and job/income volatility. I played around with a couple of ways to summarize the trends. Here is the number of substantially negative (monthly losses greater than 0.25% of the workforce) jobs reports per decade:
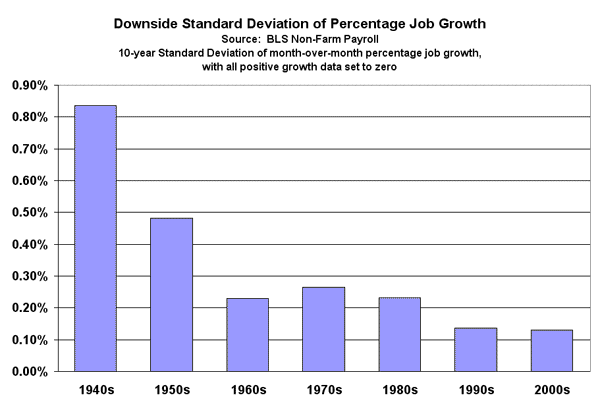
And here is a metric of the volatility of the jobs number. Since most folks don't really buy the classic economic argument that "risk" equates to volatility up or down, but feel that risk is only to the downside, I have looked at what is sometimes called the downside standard deviation of the jobs change numbers, in which all monthly data greater than zero are set to zero, and then a normal standard deviation is taken on the data.


Great data! I'm loving this. If only when I showed these graphs to my leftist friends they didn't think I was somehow brainwashing them with propaganda, but showing them facts.
That's a great line graph. But it does indeed show that the sort of down month we've just had is typical of recessions, not found at other times, and worse than the worst months of the 90-91 recession, and following 9/11. Of course, a recession would be expected to have several such months. This has not happened yet, but seems likely now.
If the data were drawn from a normal population (unlikely to be strictly true, but often close enough for our purposes), then the reduction on volatility can be pegged (in part) on the growing size of the workforce. This is just the usual 1/sqrt(N) statistics.
.
Would you care to comment on the apparent downward trend in the firs graph? The decrease in volatility is interesting, but what does the trend mean?
I find it intresting how the pattern is very cyclical. Says a lot about how little the current fad fix is worth. things will fix themselves as long as the government stays out of the way.
I see three eras to the top graph, corresponding to three broad monetary policies:
Drunk Keynesian era, producing the most volatility. The Fed drives drunk, wildly overcorrecting the monetary steering wheel, trying to avoid hitting unemployment on one side of the road and inflation on the other. Sober Keynesian era, with less volatility after drinking a few cups of coffee, but still following an theory that doesn't match up to reality. And Post Keynesian era, least volatility because it tries to focus on stable inflation levels by following the road instead of obsessing on the obstacles to the side.
All three suffer from business cycles because all three are trying to drive manually instead of letting the auto-correcting self-steering car drive itself.
Bob Sykes,
I assume you are asking why the average annual increase in employment was larger in the 60's and 70's than it is now.
Boomers joined the workforce from 1965 to 1985. Their numbers were much larger than the generation before them. The impact was greatest in percentage terms in the 60's and 70's before tapering off. The same number of workers were being added by the late Boomersin the early 80's. By then, though, the early Boomers had already expanded the base so much that the impact of 4 million new workers per year was much lower.
After 1985, those born in the post-Boomer baby bust started entering the workforce. Their lower numbers could not match the earlier gains from the Boomer generation. In fact, had immigration not offset the effects of the baby bust, employment growth would have been much lower.
At the same time that Boomers were starting to work, houeswives were leaving the home in greater numbers. After the 1970's liberation movement, housewives began to remain in the workforce even after childbirth. The impact of that cultural change was complete by the mid-1980's, aftrer which the percentage of women in the workforce leveled off.
Demographics and culture change fully account for the slower annual growth in the workforce since the mid-80's.
"the popular leftish notion that the decline of traditional American manufacturers (e.g. autos) and unions have led to increasing risk and job/income volatility."
Hard to believe that unions have provided income stability. Steelworkers strikes in 1952 and 1959 impacted more than just the U.S. steel industry. Many believe the latter led to globalization of the steel industry, as steel's customers were forced to import Japanese and Korean steel.
The lengthy 1965 Longshoreman strike idled much more than just the 60,000 striking longshoreman. 130,000 maritime workers, truckers, and railroad workers were also idled. Other industries could not get deliveries of raw materials and cut back on plant labor.
I certainly believe our economy has stabilized as union power has declined.
"If only when I showed these graphs to my leftist friends they didn't think I was somehow brainwashing them with propaganda, but showing them facts."
Leftists do not accept that there are such things as 'facts'.
Nice analysis. I think I would count the '40s as an outlier due to the war IMHO.
My guess would be that the reduced volatility was a combination of more people working in the state sector where you don't get fired & regulations & diversity rules preventing firing & therefore discouraging hiring if the hirer isn't sure the economy has picked up.