The US Has the Least Poverty In the World -- Here Is How Metrics Are Crafted to Hide That Fact
A few weeks ago Matt Yglesias published a tweet (since deleted, which I don't totally understand as I thought it was pretty innocuous from a Progressive viewpoint) saying that he wanted to spend more time focusing on "relative child poverty." What the heck is "relative" child poverty? I want to spend a bit of time discussing why this is a useless metric, helpful only if one want to try to sell socialism in the US.
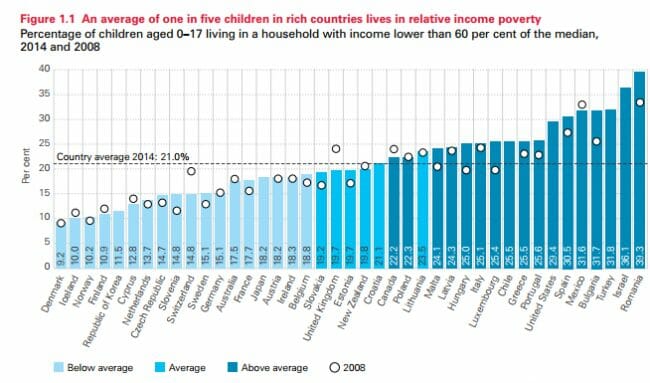
Relative child poverty is a metric based on the country's median income -- how many kids live in families with income that is X% of the median. Here is an example (source):
If you click on the source, the headline presents this as "These rich countries have high levels of child poverty." The implication is that the US has more child poverty than Latvia or Poland or Cyprus or Korea and only slightly less child poverty than Mexico and Turkey. But does it really mean this? No. This chart is a measure of income equality, NOT the absolute well-being of children.
Many of the countries ahead of the US are there not because their poor are well off, but because their median income is so much lower than ours. In fact, you will notice the lack of African and Asian countries in this. I will bet a lot of money that certain countries in Africa and Asia everyone knows to be dirt poor would beat out the US in this, thus making the bankruptcy of this metric obvious.
Take Denmark in the #1 spot. It looks like 20% more kids in the US live in poverty than in Denmark. But per the OECD, the US has a median income 41% higher than Denmark. So what it really means is the US has 20% more kids living under an income bar that is set 41% higher. How can this possibly have any meaning whatsoever, except to someone who wants to make the US look bad?
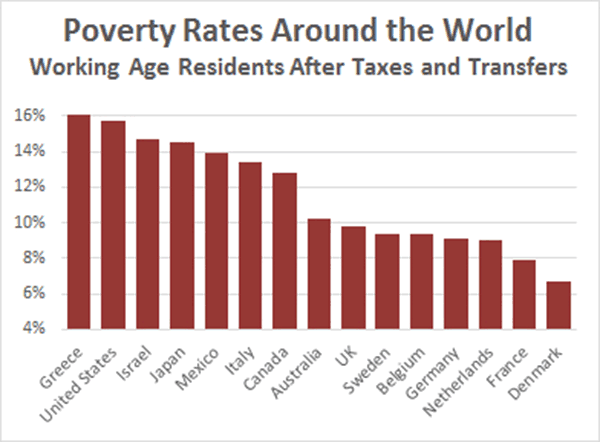
The chart below does the same thing -- it has nothing to do with absolute well-being, but defines poverty as living below some percentage of that country's median income. In this metric, a country where everyone equally made only $1000 or even $10 a year would have 0% poverty!
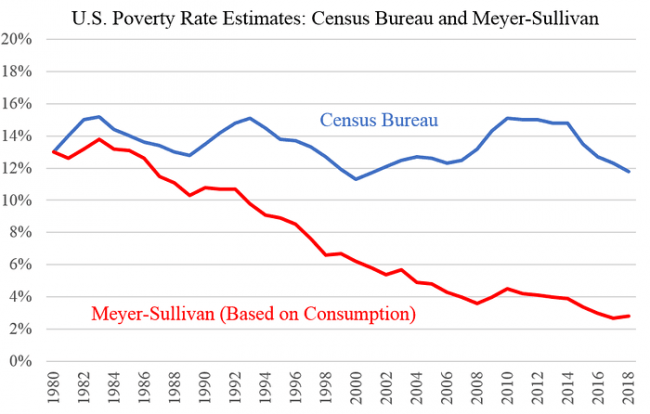
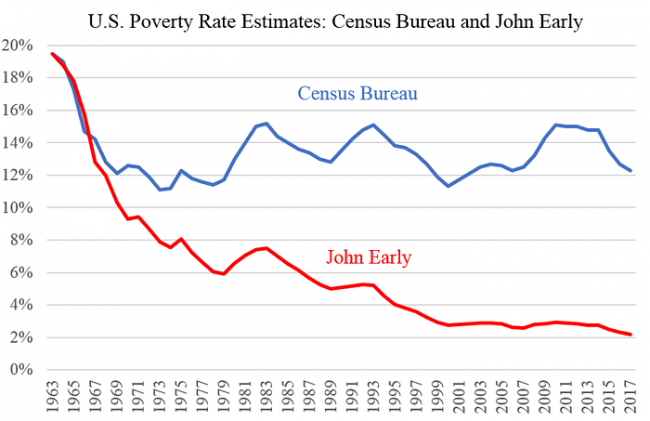
Within the US, the same game is being played with poverty stats. Despite decades of government income distribution and poverty programs, the stats appear to show that the US has nearly unchanged poverty rates. But this is because the census data on which the poverty stats are based EXCLUDE government transfers -- in other words, they exclude the effect of many or most of these poverty programs. When this and other issues are corrected for, US poverty rates have dropped to all-time historic lows (source)
Here is another study coming to a very similar conclusion.
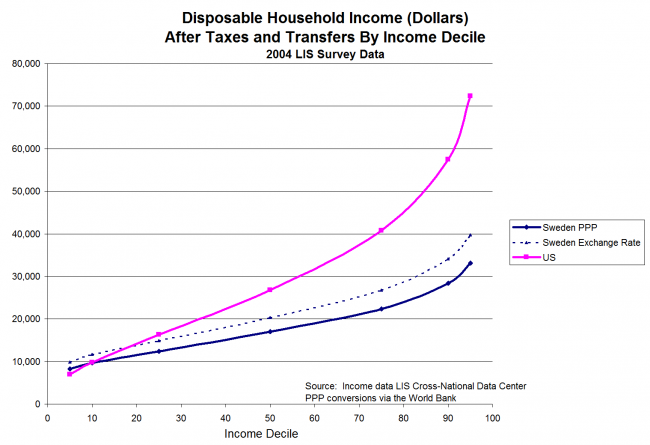
One thing you never, ever, ever see is comparisons of the poor in the US to poor in other countries on an absolute well-being basis after transfer payments. That is because the bottom 10 or 20 percentile in the US are among the top half of richest people in the world, and in many nations they would be among the top 10%. It is possible to make these comparisons, though. I did so several years ago from a data set I saw Kevin Drum using (ironically to try to make the point the US is worse than Europe, again by using relative poverty numbers). I am sorry this data is old, but there is a long time-delay in the data source itself and I have not updated the analysis for a couple of years (on my to-do list, though).
Here are the US Bernie-Socialist favorites Denmark and Sweden:
I know progressives would argue that if you take more from the right end and give it to the left end, our poor would be even better off. But we have a control group for this -- Including Sweden and Denmark -- and that is clearly NOT the result one gets. The problem with this theory is that forcible income redistribution policy and economic growth / prosperity are not independent variables. When you redistribute the pie, you get a smaller pie.
If one wishes to compare poverty across countries, the way to do it should be to compare the disposable incomes after taxes and transfers (adjusted for PPP) of the 10th or 20th income deciles in each country. This seems obvious to me, after all we use the median (50th decile) income to compare prosperity across nations, so why not the same approach for poverty? But no one ever does it. My guess is the point is to exaggerate poverty in the US and understate it in socialist nations.
Update: In related news:
Well, in 1820, 94 percent of the world’s population lived in extreme poverty (less than $1.90 per day adjusted for purchasing power). In 1990 this figure was 34.8 percent, and in 2015, just 9.6 percent.
In the last quarter century, more than 1.25 billion people escaped extreme poverty - that equates to over 138,000 people (i.e., 38,000 more than the Parisian crowd that greeted Father Wresinski in 1987) being lifted out of poverty every day. If it takes you five minutes to read this article, another 480 people will have escaped the shackles of extreme of poverty by the time you finish. Progress is awesome. In 1820, only 60 million people didn’t live in extreme poverty. In 2015, 6.6 billion did not.
