Natural Climate Variability and Mann's Hockey Stick
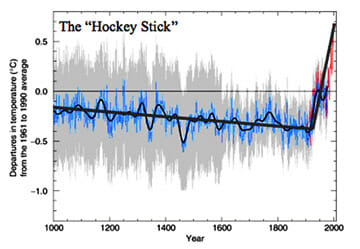
Most folks even slightly acquainted with the climate debate have seen Dr. Mann's hockey stick. It is a historical temperature reconstruction using proxies such as the width of tree rings.
There were a zillion problems with this analysis, which I and many covered years ago and, frankly, I am past my tolerance in reiterating once again. Just to name three:
- The inflection of the hockey stick occurs right where two completely different data sets - proxies and actual thermometer readings -- have been grafted together, leading one to wonder if the inflection is a real natural phenomenon or instead related to differences in how the data was gathered
- The blue line, of the proxy data, ends in 1950. The reason for that is that the proxy data actually shows temperatures falling since 1950. This does not mean that temperatures actually fell - we are sure they have risen -- it means that the proxies are not very good proxies. If they are not following temperatures well in the last 50 years, why do we think they mirrored temperatures well in the 1000 years before that?
- As Steve McIntyre showed, while Mann used many proxies, his statistical method basically over-weighted a single data set from bristlecone pines in California and used techniques that were shown later to generate hockey sticks even from random noise.
Anyway, you can search Google and spend most of the day reading critiques and defenses of Mann.
But I think a lot of laymen missed the point of the analysis. Folks want to say that the hockey stick proves we have a big current spike in temperatures -- ie they focus on the blade of the hockey stick. But we already knew from surface temperature records that world temperatures have risen perhaps 0.8C over the last century. And besides, as mentioned above, Mann's proxy data does not even confirm or support the current working.
No, the "insight" of the hockey stick analysis was the handle -- the fact that until 1900, Mann was essentially claiming that temperatures had been 1) dead flat with limited variation and 2) consistently well below current temperatures. Prior to Mann's analysis, most scientists had a picture of past climate that had a warm period from 1000-1300 that was perhaps as warm as it is today followed by a cold period (called the medieval warm period and the little ice age). Most of this was based on historical analysis. Go to your local university and find a medieval historian. Going forward, universities will probably not teach any European history any more, but you probably can find a few old folks still hanging on via tenure. I took an audio course from Philip Daileader of William and Mary and he started his course on the high middle ages (1000-1300) by saying the most important fact of that period was the demographic expansion allowed in part by a warm and favorable climate. The warm climate allowed more food production as new areas, particularly in the north, could be brought into production. In turn, after 1300, Europe was met with a cooler and wetter climate that created a horrible famine in the 1320's, which in turn likely weakened the population and made the black death a few decades later all the worse. Later on, we have records of canals and rivers freezing across Europe that almost never freeze today. This colder period lasted until the early 19th century (I use 1812 as a break as I think of the freezing Russian winter of that year that sent Napoleon home without most of his army). Temperatures and sea levels began rising after that, long before man was burning fossil fuels in earnest.
This historical picture, shared by pretty much everyone until 20 years ago, was overturned by Mann. Look at his chart - no warm period in the middle ages, and no substantially colder period just afterwards. How did he refute the historical evidence, which is robust? He waved this evidence off as limited to Western Europe. Which was sort of funny, because most of his proxy data came from an even smaller area, the mountains east of Bishop, CA**.
So all this is a leadup to a new study out of China looking at temperature proxies for China. And it turns out China, which is on the other side of the world from the west (I know that because when Bugs Bunny digs straight down he always comes out in China), has pretty much the same temperature history everyone before Michael Mann thought we had in Europe.

**postscript: If you have a sports car, and want to drive a curving mountain road that does not have a lot of big cliffs and has pretty much zero other cars to get in the way, you might try Highway 168 from near Bishop up towards the ancient bristlecone pine forest.
"If you have a sports car, and want to drive a curving mountain road that does not have a lot of big cliffs and has pretty much zero other cars to get in the way, you might try Highway 168 from near Bishop up towards the ancient bristlecone pine forest."
That sounds delicious, although the cliffs do make things a bit more exciting and give us extra incentives to not go too crazy with our sports cars. In any case, the biggest danger of driving fast cars on windy mountain roads tends to be bicyclists going 7 MPH in the middle of the single lane.
For a pop culture reference that would extend the Little Ice Age further into the 19th century, the lyrics of both "Jingle Bells" and "Over the River and Through the Woods" reference travelling by horse-drawn sleigh on Thanksgiving.
I have my own version of scientific proxy. When a supposed scientist will not release his data or methods, he is not a scientist and cannot be trusted. His openness to review and criticism is a proxy for being a scientist
09/23/09 - National Review: The Dog Ate My Global Warming Data
=== ===
Phil Jones and Tom Wigley authored the first comprehensive history of surface temperature, in the early 1980's. They worked at the United Kingdom’s University of East Anglia, Climate Research Unit. Their paper was the primary reference for the U.N. Intergovernmental Panel on Climate Change (IPCC) until 2007. It supported the IPCC claim of a “discernible human influence on global climate", a warming of 0.6° ± 0.2°C in the 20th century.
Jones and Wigley used data from ground weather stations not designed to monitor long term trends. Many stations were placed near trees, in parking lots, and near heat vents. Changing urban settings surely biased readings. They modified the temperature data before using it in climate models. But, Jones and Wigley did not report their original data or how thay had modified it.
The Australian scientist Warwick Hughes wondered where the error estimate of “± 0.2°” came from. He wrote Phil Jones in early 2005, politely asking for the original data.
Jones responded “We have 25 years or so invested in the work. Why should I make the data available to you, when your aim is to try and find something wrong with it?”
=== ===
These are not scientists, because they refuse to subject themselves to scientific discipline. They are merely witch doctors or politicians without that discipline. They fail the minimal test for being believed as scientists.
Supposed climate scientist Michael Mann sued Dr. Tim Ball in Canadian court for libel, following Ball's public criticisms of Mann. The case has come to this startling point. Mann stands to lose money and reputation for failing to provide the data supporting Mann's publications and the hockey stick graph.
( http://www.principia-scientific.org/michael-mann-faces-bankruptcy-as-his-courtroom-climate-capers-collapse.html )
2/21/14 - Michael Mann Faces Bankruptcy as his Courtroom Climate Capers Collapse
=== ===
[edited] Mann refused to disclose his ‘hockey stick’ graph metadata in the British Columbia Supreme Court, as he is required to do under Canadian civil rules of procedure, This is a fatal omission to comply, rendering his lawsuit unwinnable. Mann failed to show he did not fake his 1000 years of tree ring proxy data.
Hundreds of papers in the field of paleoclimate temperature reconstructions that cite Mann’s work are likewise tainted, heaping more misery on the discredited UN’s Intergovernmental Panel for Climate Change (IPCC) which has a knack of relying on such subprime science.
=== ===
Amen, and in this part of the country (the northeast), equally troubling are the damn deer, many of which seem to be suicidal. Usually, you can see you are coming upon wannabe Lance Armstrongs in their tight clothing and aero-shaped helmets; I always like to downshift and accelerate by them with a friendly wave. But deer tend to dart our without warning.
The National Park Service still believes in the Little Ice Age, at least concerning Alaska's Glacier Bay. https://www.nps.gov/glba/planyourvisit/upload/Complete%20brochure%20two%20sides.pdf. There are four maps based on actual local data concerning the glaciers' extent. In 1680, about 1/2 of the bay was open water. About the Little Ice Age, it says (map 2): "The Little Ice Age came and went quickly in geologic terms. By 1750 the glacier reached its maximum, jutting into Icy Strait, but 45 years later, when Capt. George Vancouver sailed here, the glacier had melted back five miles into Glacier Bay, which it had gouged out."
The remaining maps show the extent of the glaciers in 1880 and today. So warming started in Alaska around 1750 and has continued to this day. I keep a PDF of this brochure for the day that this map goes down the memory hole.
An interesting thing out the hockey stick graph and the 50 years of proxy data that got erased. Tree ring proxies only tell you something about how optimal the summer growing season is at high latitudes. It tells you little about the dormant months or what happens at night. The instrumental temperature data in the northern latitudes shows that most of the warming is in the cold months and at night so tree rings shouldn't be growing any faster than before. So to reiterate Warren's point, its the handle of the hockey stick from Mann's proxy data that's not giving a true reading of the climate.
In order to believe the regional nature of the MWP as claimed by the warmists - you have to believe an extreme weather event lasted over the same small piece of the globe for 400 odd years. ie a heat wave lasted 400 years over north western europe and the north atlantic - seriously.
Yet the esteemed global scientists and the GW activists cant pick up on the absurdness of the concept.
It's not as far fetched as it seems (although I suspect it would be unlikely in northern Europe). I recall there is evidence of a 300 year drought a few thousand years BC in the region of the Tigres, Euphrates and northern Persian gulf. Could have been the motivating factor for the chosen people in the bible to move from that region to the shores of the Mediterranean Sea. Then there are the stories of the Anasazi native Americans that populated AZ, NV and Southern Utah. Drought supposedly forced them out about 800 years ago. So patterns develop and they do get stuck but most I'm aware of are in fairly arid regions to begin with.
Sean - I agree there is evidence of of 200-300 droughts, etc.
My point is that
A) the warmist theory of the regional nature is awful "convenient"
B) ie hard to get a cooler period in northern europe with the volumous contemporary written record,
C) but much easier using the much lower resolution proxy data where a the contemporary written record is very sparse or non - existant.
I could be wrong in my recollection, but it seems that the "hockey stick" chart was the first particularly public revising of prior climate history. It seems to me that the true lasting impact of the hockey stick is that headlines matter more than truth (sadly not limited to climate "science"), and the past can be re-written with little push back.
Climate alarmists like to ignore that glaciers have been melting for hundreds of years. It's actually another good example of Warren's criticism of the media drawing trends from a single data. The alarmists go "OMG! Glaciers melted a whole bunch between 2005 and 2015!" and then completely ignore that they melted roughly the same amount every previous decade for the past 200 years.
Every couple of years there's a breathless story about some village or houses being uncovered as glaciers melt in the Alps. What''s ignored is that the glacier must have receded even further up the valley than today for someone to build the structure in the first place and then it had to get cold enough for the glacier to advance and cover everything up.
Andrew Garland: Mann stands to lose money and reputation for failing to provide the data
supporting Mann's publications and the hockey stick graph.
Um, the data are here:
http://www.realclimate.org/index.php/data-sources/
That is excellent news. You should forward your link to Mann so he doesn't waste time refusing to produce it in court.
You may not be aware that scientists choose from all available data, apply changes, process with software according to their particular choices, and then interpret the results. That is often shortened to "data" in reporting. Mann has not submitted his work which would support his claims and graphs.
http://principia-scientific.org/
Has a number of articles about the sorry case of Michael Mann. Search: Mann
My link above to "Michael Mann Faces Bankruptcy" is garbled. Use the following:
http://principia-scientific.org/michael-mann-faces-bankruptcy-as-his-courtroom-climate-capers-collapse/
That was from 2014. An article from 7/2017 confirms that Mann continues to be in legal trouble and still will not support his scientific work.
( http://principia-scientific.org/breaking-fatal-courtroom-act-ruins-michael-hockey-stick-mann/http://principia-scientific.org/breaking-fatal-courtroom-act-ruins-michael-hockey-stick-mann/)
7/4/17 - Breaking: Fatal Courtroom Act Ruins Michael Mann
If you look at more recent temperature reconstructions, you will notice the overall trend from 1000 years ago is down, until the sudden rise at the end. This seems to be consistent with Mann's early findings.

Yes. It's already known that many areas of the globe were warm about 1000 years ago, and then cooled until the twentieth century. That's shown in Mann's early findings. As for the rapidity of the change, it is not atypical for regional changes to occur faster than global changes.
Andrew Garland: You should forward your link to Mann so he doesn't waste time refusing to produce it in court.
Mann provided his methodology and data with the paper. You will find the methodology in the methods section of the paper.
Andrew Garland: Mann has not submitted his work which would support his claims and graphs.
See Mann et al., Global-scale temperature patterns and climate forcing over the past six centuries, Nature 1998; Mann et al., Northern hemisphere temperatures during the past millennium: Inferences, uncertainties, and limitations, Geophysical Research Letters 1999.
To Zacharial,
Mann has convinced you that his methods and data are correct. But, Mann has not submitted data and methods to the satisfaction of the court. Is the reporting about the case fanciful? Is the court obtuse and biased?
My reading of the reporting is that Mann has used all available excuses not to submit anything, and the court is unsatisfied.
Say that you are correct that all needed data, methods, and processing has been disclosed elsewhere. Then, Mann is an idiot for not providing a copy to the court. You should inform Mann about how simple it would be to submit what he has already published.
Scientific papers can be published without all detail being included, and I expect that is the case with Mann's publications. That detail is now required.
Dr. Tim Ball found Mann's paper to be lacking and criticized Mann accordingly. Mann has not rebutted those criticisms. I judge Mann's actions and the claims of opposing scientists. My reading of his papers is immaterial.
If you have no credentials or publications in support of your position, then your feelings are also immaterial.
Andrew Garland :But, Mann has not submitted data and methods to the satisfaction of the court. Is the reporting about the case fanciful? Is the court obtuse and biased?
It's likely you are misinformed about the court proceedings.
Andrew Garland :Dr. Tim Ball found Mann's paper to be lacking and criticized Mann accordingly.
Actually Ball said of the email controversy that Mann "should be in the State Pen, not Penn State," literally, that Mann is a criminal. Ball's defence is that he said it in jest. Consequently, the defence has nothing whatsoever to do with the validity of Mann's paper or anything to do with climate science.
To Zachriel,
Mann's lawer says that, in a comment to the July 4, 17 article I gave a link to before and below. I didn't see it before you pointed it out.
OK, Mann's lawyer says he has done everything required, Tim Ball's side says he hasn't. We'll see how it works out.
In the meantime, that article
http://climatechangedispatch.com/
breaking-fatal-courtroom-act-ruins-michael-hockey-stick-mann/
shows the focus of the controversy. Ball did a graph from public information and compared it to Mann's graph. See the graphs there. Ball decided that Mann had manipulated data to come up with Mann's version. Mann hasn't explained how he computed his graph.
Ball quipped that Mann should be in jail for the quality of his work, but that is not all of the controversy. Are Mann's publications correct or not?
Mann's graph is criticized for not showing the Medieval Warm Period from 1000-1300 and the Little Ice Age from 1500-1900. Both of those periods are well documented historically. How did Mann get rid of them? If his tree ring data really do not show those events, then his trees are stupid, and his studies do not help to understand climate.
These warm and cold periods are also shown in the graph of the Chinese study which Coyote shows above.
Andrew Garland: OK, Mann's lawyer says he has done everything required, Tim Ball's side says he hasn't.
As the defence is that the comment was said in jest, the science is irrelevant to the court case. If you are being misled on this, shouldn't your be somewhat skeptical of your sources?
Andrew Garland: Mann's graph is criticized for not showing the Medieval Warm Period from 1000-1300 and the Little Ice Age from 1500-1900.
Mann's graph shows it warmer a thousand years ago, then cooling until modern times.
Andrew Garland: Both of those periods are well documented historically.
You seem to be conflating regional climate with global mean temperature. Not all areas of the globe were affected by the warming at the same time or the same rate. That tends to smooth the graph.
Andrew Garland: These warm and cold periods are also shown in the graph of the Chinese study which Coyote shows above.
The graph is dated, if that is what you mean.
As an example of the mental capacity of the True Believers - one of the posters on another forum stated that proof of AGW was that it has been warm in the arctic region for 3 weeks now.
Another graph. NOW, I'm convinced!
This whole debate just gets old. We know where the crooks are. Eisenhower warned us.
I'll believe them ONLY when I see them actually stop using fossil fuels. I frankly give two craps about their stupid graphs. I only care about how my house is going to get warm in the winter. PV Panels aren't going to do it. How is ole Michael gonna fly to his hoity-toity conferences in VIenna without fossil fuels? Oh, again...ain't gonna happen.
It's called data.
uh huh.